A dynamic state transition framework for forecasting drug sales in rapidly-progressing diseases
Forecasting drug sales is arguably the most important part of investing in drugs or pharmaceutical companies. Forecasting models are often trading off precision and complexity depending on where they are being used and what inputs are available to the forecaster. In a slowly progressing disease like diabetes, for example, it is probably fine to treat the patients in each line of therapy as a pool of identical patients. This greatly simplifies forecasting without sacrificing much accuracy or precision especially when forecasting annual sales. The size of the pools and their rates of change are in general readily available. For rapidly progressing diseases like cancer, however, treating patients as homogenous pools and using annual figures may greatly compromise accuracy and precision. Individual patient data, however, is often not available to investors so patient data is simulated from aggregate data. These simulations are difficult or impossible to implement in spreadsheets and therefore necessitate specialized software or a programming language.
I created a framework in Python to implement these dynamic microsimulations for the purpose of sales forecasting. I use three classes of objects: patients, drugs and states. Patient objects take a set of drug and state objects. The patient object executes the steps in the decision tree and reports results. A simulation consists of initializing the desired number patients in each period and collecting their results. The patient decision tree / graph involves checking for survival, checking for continuation of the current treatment, then selecting a new drug if they choose to discontinue. The key inputs are market share (probability of choosing a given drug), survival rate and treatment continuation rate. Each is specified by line of therapy and by number of periods on current treatment.
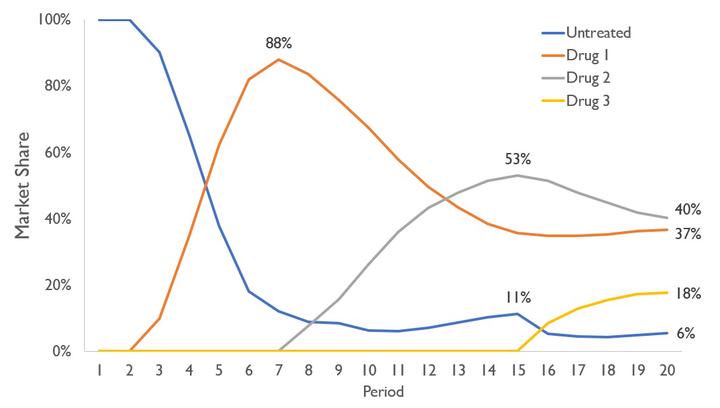
The graph above shows an illustrative example. Drug 1 becomes available first in period 3 followed by Drug 2 in period 8, and Drug 3 in period 16. There are three lines of treatment and each drug can be used in any line. Drugs 1 and 2 are identical and Drug 3 is much worse (patients choose Drug 3 only 5% of the time). This simple example shows some interesting insights that result from this modelling technique. For example, even though Drugs 1 and 2 are identical, Drug 2 enjoys a strong launch (surpasses Drug 1) by competing for first line patients and capturing the second line patients upon launch. Additionally, Drug 3 captures a considerable market share despite being far inferior due to the lack of competition for third line patients.
The entire project was developed independently. After completing this project, I came across these topics when working for Petros Pechlivanoglou. He and his collaborators have an excellent series of papers on these types of models in R.
Sample papers:
- Krijkamp E, Alarid-Escudero F, Enns EA, Jalal HJ, Hunink MG, Pechlivanoglou P. Microsimulation Modeling for Health Decision Sciences Using R: A Tutorial. Med Decis Making, 2018;38(3):400-422.
- Jalal HJ, Pechlivanoglou P, Krijkamp E, Alarid-Escudero F, Enns EA, Hunink MG. An overview of R in Health Decision Sciences. Med Decis Making. 2017;37(7): 735-46.